By Bob Jones
The first time I walked into a science classroom one wall had a huge chart hanging on it.
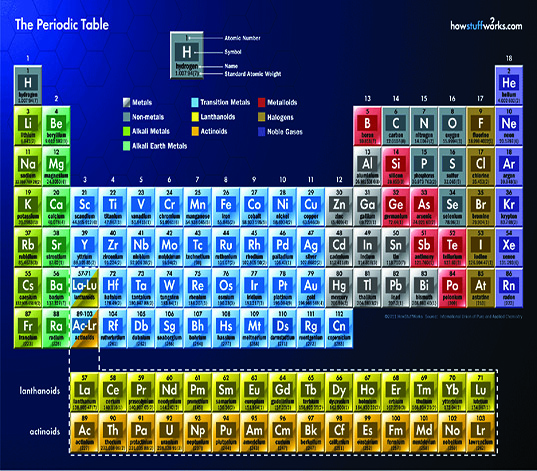
The chart was covered with small boxes arranged in vertical columns and horizontal rows. Each box was marked with either a single capital letter or a capital and lowercase letter combination. They were arranged in numerical order starting with 1 and ending with 92.
Across the top of the chart, in large capital letters, was the title “Periodic Table of Natural Elements”. The chart was a mystery to me at the time—I learned later that it was a very useful scientific tool.
Clues In the Elements
The chart’s title contains clues as to its usefulness. It lists the 92 naturally occurring elements found in the crust of the earth. Most of the elements are metals, and are listed on the left side of the chart. The rest are nonmetals and gases, and are arranged on the right. Together, these elements comprise the earth and the minerals we collect.
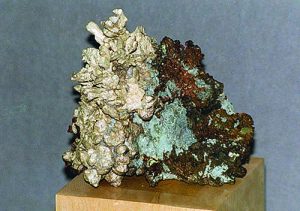
Simply stated, elements are those substances that cannot be separated or broken down by chemical means. The term “natural” simply means these elements are found in the earth and are not man-made. Man-made elements appear at the end of the chart, after natural element #92.
The atomic number 1 and the symbol H on the chart represent the element hydrogen. The number indicates the number of positive protons in the element’s atom. Uranium has 92 protons in its nucleus, so its atomic number is 92, and so on.
In most cases, the symbols are obviously derived from the name of the element in the box: He for helium, C for carbon, and so on. Other elements are assigned symbols that have no apparent relation to the name. These are taken from an older name for the element. Gold, for instance, was known as aurum, so its symbol is Au.
Purpose of Element Placement
Neither the columns nor the rows are all the same length. This is done for a purpose. The elements in each row or column are related by their properties. Scientists use each element’s atomic number and chemical properties to determine its position on the chart.
Protons are positively charged, and they determine the number of negatively charged electrons each element should have to balance its electric charge. The nuclei of elements also contain neutrons, which are electrically neutral. The number of protons is added to the number of neutrons to determine the atomic weight of an element. Fractional weights are due to extra neutrons in some atoms.
The protons determine the position of the element on the chart, but do not participate in any chemical reactions. The electrons of an element are key to its chemical action, and they surround the nucleus in a very orderly arrangement.
Early diagrams of atoms show the electrons circling the nucleus, just as planets circle the sun. We now know that electrons arrange themselves much differently, but we still envision them in “orbitals” around the nucleus of each element. Each orbital can hold only a set number of electrons.
Understanding Electron Orbitals
The first electron orbital of any element is closest to the nucleus and can only hold two electrons. While hydrogen only has one electron, all other elements have two electrons in their first orbital. If there are more than two electrons, they must go into a second orbital, which can hold up to eight electrons. For example, neon has 10 electrons, so two of them are in the first orbital and eight are in the second orbital.
Anytime that last orbital has a full complement of eight electrons, the element is chemically inert, or inactive. Any element with fewer than eight electrons in the outer orbital is chemically active. Helium, which only has two electrons, is an exception to this rule.
Argon (18) has two electrons in the first orbital, or shell, and eight in the second and third orbitals, meaning it is chemically inert. Krypton (36) has a third orbital that can hold 18 electrons. Its orbital arrangement is 2-8-18-8. Finally, xenon (54) has 54 electrons, arranged 2-8-18-18-8.
These elements’ properties are chemically similar, so they form a group that occupies a single column on the chart. They are all gases—we call them the “noble gases”—and are chemically inert.
Comprehending the Columns of the Table
The first column on the table, beginning with atomic number 3, contains the “alkali metals”. They are lithium (Li, #3), sodium (Na, #11), potassium (K, #19), rubidium (Rb, #37), and cesium (Cs) #55. These elements have electron arrangements of Li 2-1, Na 2-8-1, P 2-8-8-1, Rb 2-8-8-18-1, and Cs 2-8-18-18-8-1. The last electron orbital of each of these elements has one electron in it, which means they are among the most chemically active metals. Metals are elements that tend to give up their outer orbital electrons in a chemical reaction. The alkali metals are all solid, metallic, electrically conductive, and shiny.
Metal elements give up their outer orbital electrons during a chemical action. This normally happens when the metal’s outer orbital has three or fewer electrons in it. If an element has five or more electrons—excluding the number eight—in its outer orbital, it is a nonmetal.
Some elements have four electrons in their outer orbitals and can either take in or give up electrons. They are #6 carbon (C 2-4); #14 silicon (Si 2-8-4); #32 germanium (Ge 2-8-18-4); #50 tin (Sn 2-8-18-18-4); and #82 lead (Pb 2-8-18-32-18-4). These elements have some metallic properties and some nonmetallic properties, so we call them semiconductors, or metalloids. For example, lead can be shiny like a metal, but is extremely soft like a nonmetal. Carbon is certainly not shiny, but does conduct electricity like a metal. Metalloids are positioned on the chart between the metals, on the left, and nonmetals, on the right.
Simply stated, the goal of an atom is to have a complete last electron orbital. Scientists have shown that, if the last orbital of an element has fewer than four electrons, it tends to give up those electrons in a chemical reaction. If the last orbital has more than four electrons in the last shell, it tends to seek and take in electrons to reach eight. To generalize, metals tend to give up their electrons, while nonmetals tend to seek and take in electrons in chemical reactions to form stable compounds.
Rows Define ‘Period’
That explains the groupings, but how are the rows arranged? This is where the word “period” comes into play. As the number of protons and electrons increased, scientists began to recognize that elements with similar properties would appear periodically. They also noted that the atomic weight of some elements formed a mathematical relationship in groups of three, which they labeled “triads”. For example, add sulfur’s atomic weight (16) to tellurium’s atomic weight (52), and you get 68. Divide 68 by 2, and you get 34, which happens to be the atomic weight of selenium (Se). It falls between oxygen and tellurium in column 16 on the chart.
Scientists reasoned that this was no accident; these elements had to be related. This periodicity was used to develop the horizontal rows on the chart. The electrons in the outer orbital of these elements are called the “valence” of the element, a direct indication of how chemically active an element is.
It was clues like this that got scientists Johann Dobereiner and Lothar Meyer (Germany), Alexandre Chamcoutier (France), John Newlands (England), and Dmitri Mendeleev (Russia) to recognize that known elements were related to each other and could be charted in an orderly and useful way. There were only about 56 known elements in their time, but these scientists knew enough about the physical and chemical properties of the known elements to devise charts that could be added to as new elements were discovered.
In 1869, Mendeleev and Meyer each developed a periodic table. Mendeleev got the initial credit because he published his first, and he actually realized some elements had to exist, although they had not yet been discovered. He left spaces for them on his chart, and even predicted their properties so exactly that they were quickly discovered. He called the missing elements ekesilicon (now germanium, 32), ekaboron (now scandium, 21), and ekaluminum (now gallium, 31).
The 17th century saw the emergence of the scientific method, which allowed more natural elements to be isolated and identified. By the mid-1800s, an orderly relationship among elements and their properties was established, and an orderly table of the elements was composed.
Author: Bob Jones
 Holds the Carnegie Mineralogical Award, is a member of the Rockhound Hall of Fame, and has been writing for Rock & Gem since its inception.
He lectures about minerals, and has written several books and video scripts.


